
Abstract:
For a long time, Windows users who wanted to see which programs were using their graphics cards had only been able to obtain fairly limited information. Although the Task Manager can display basic indicators such as GPU utilization and temperature, and also supports viewing the video memory usage of individual processes, the relevant options are deeply hidden and cannot clearly explain what these processes are doing.
For users with NVIDIA graphics cards, the NVIDIA GPU Activity Monitor in the system tray can provide slightly more information, but its main function is only to list the processes currently using the GPU, and it is difficult to further explain why each program occupies graphics card resources and the specific usage. To obtain more in-depth data, users often need to query with the help of PowerShell commands.
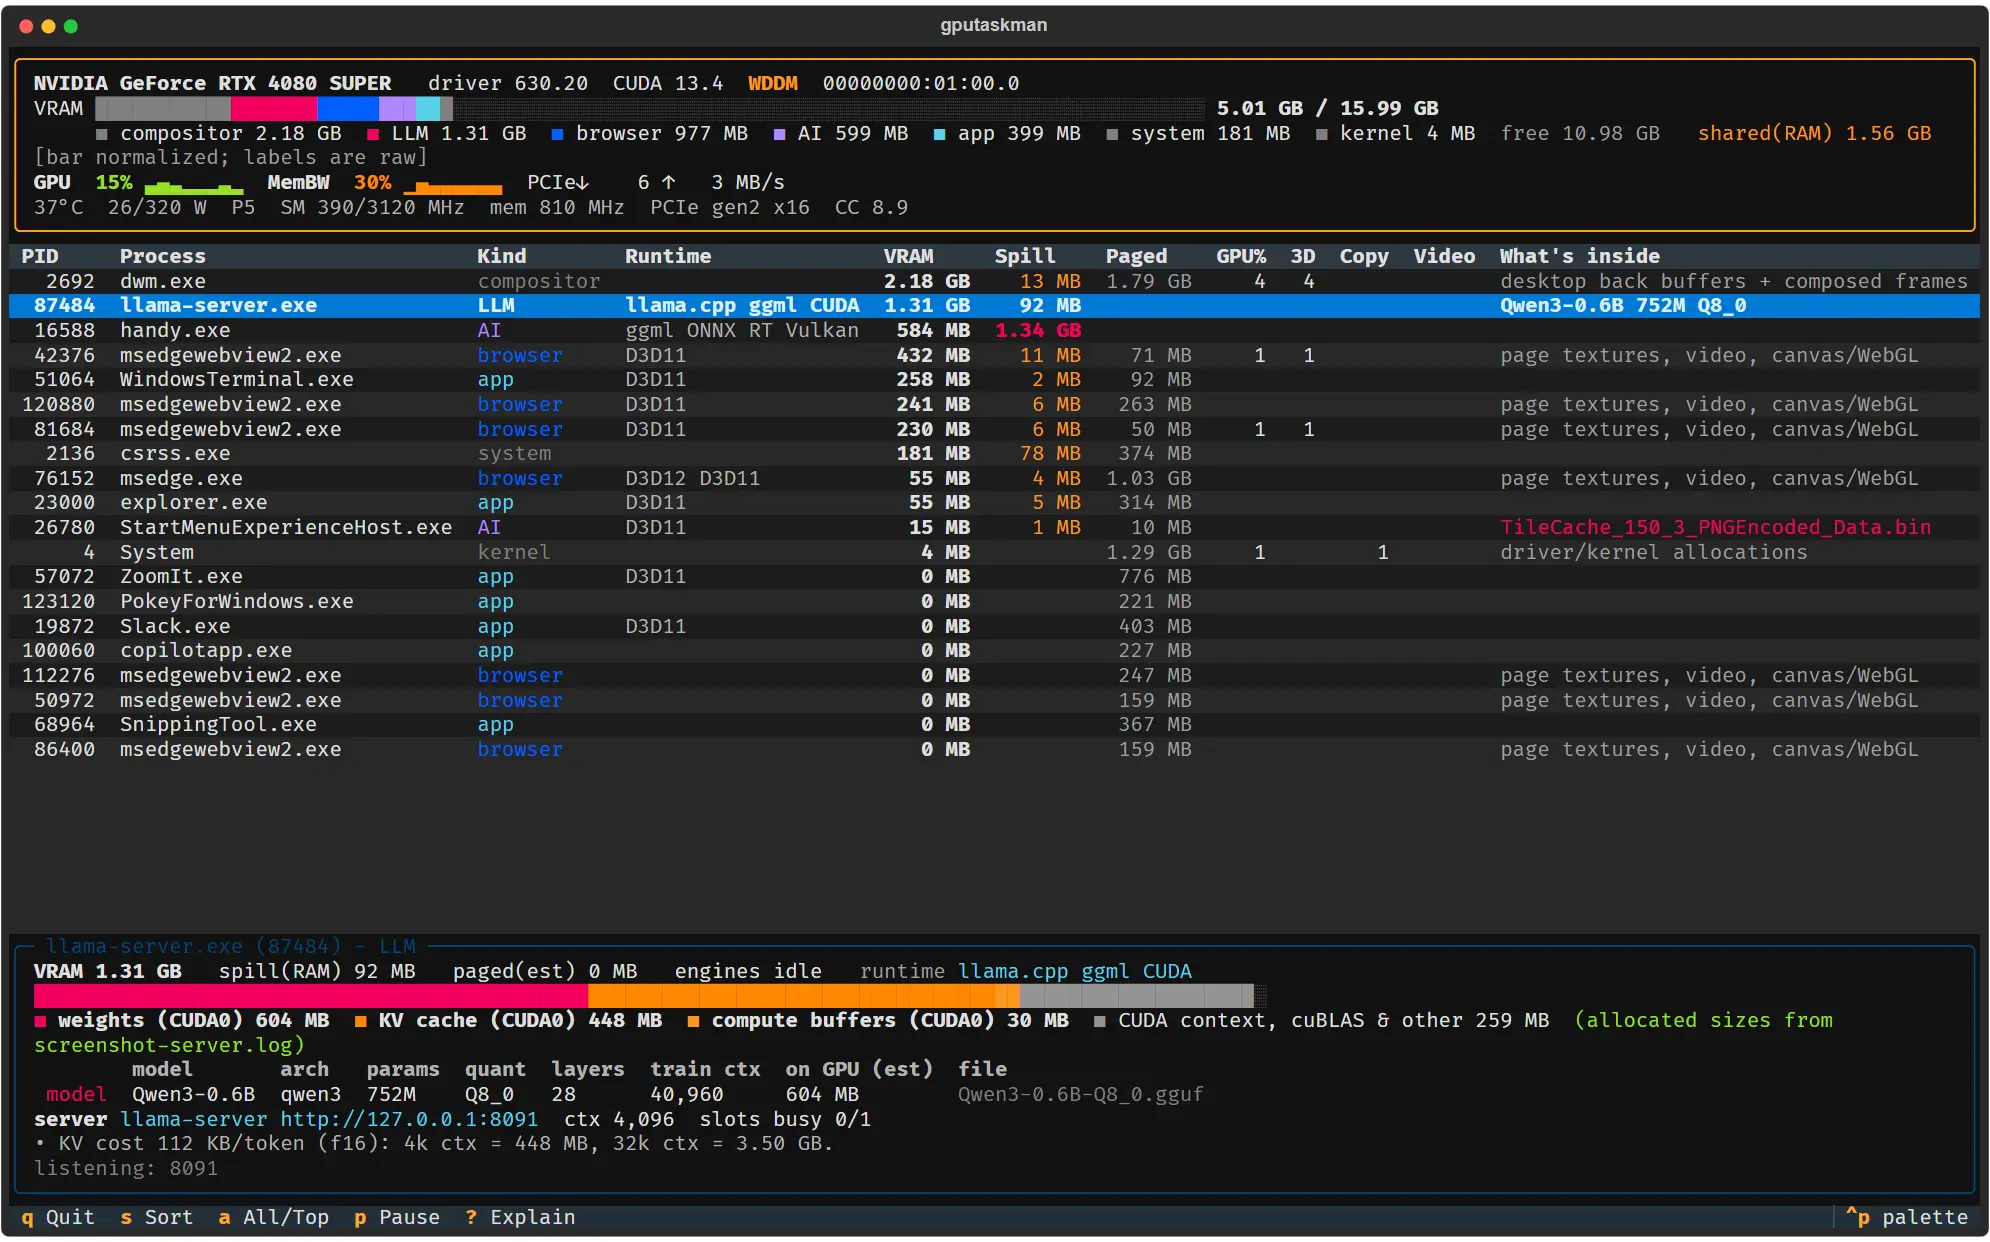
In response to this problem, Scott Hanselman, a senior Microsoft developer and current vice president of the Microsoft and GitHub technical teams, released a new tool called gputaskman, hoping to allow users to understand the actual usage of the GPU more intuitively. This tool is positioned as a graphics card monitoring and analysis software that helps users see exactly which programs are using the graphics card and how they are using these resources.
Hanselman has introduced several useful tools in the past. Earlier this year, he released PeekDesktop, which introduced macOS-like quick-view desktop functionality to Windows 11. The launch of gputaskman further focuses on the field of hardware monitoring.
According to reports, gputaskman can display a large amount of GPU-related data, including graphics card utilization, video memory (VRAM) occupation, temperature, power consumption, frequency, video encoding and decoding activities, and PCIe bus traffic and other information. Unlike traditional monitoring tools, these data can be broken down and displayed by process, making it easier for users to locate the source of resource consumption.
This tool is particularly suitable for local AI application scenarios. For a running large language model (LLM) process, gputaskman can not only identify its existence, but also display the model and runtime environment used, and further provide detailed information such as model weights, quantization methods, number of layers, and memory usage. For users who frequently run AI models locally, this data can provide a deeper understanding of how the model is performing under the hood.
In actual tests, media experience found that the tool ran normally in most cases and could display relevant indicators stably. However, there are also some minor problems, such as the GPU temperature reading occasionally staying at the same value for a period of time and failing to refresh in real time.
In this regard, Hanselman also made it clear that gputaskman is still an early experimental project. Although anyone can download and try it out, since the software is still in the early stages of development, users may encounter some functional abnormalities or stability issues during use.
Nevertheless, for users who frequently perform high-load tasks such as gaming, content creation, or local AI inference, gputaskman already provides more in-depth and practical graphics card monitoring capabilities than existing system tools.
Currently, gputaskman supports Windows, Linux, WSL, and macOS platforms equipped with Apple Silicon chips. However, there are certain differences in the monitoring indicators available on different platforms. The developer has released the project code and installation program on GitHub for users to download and experience for free:
https://github.com/shanselman/gputaskman
Comments