
Abstract:
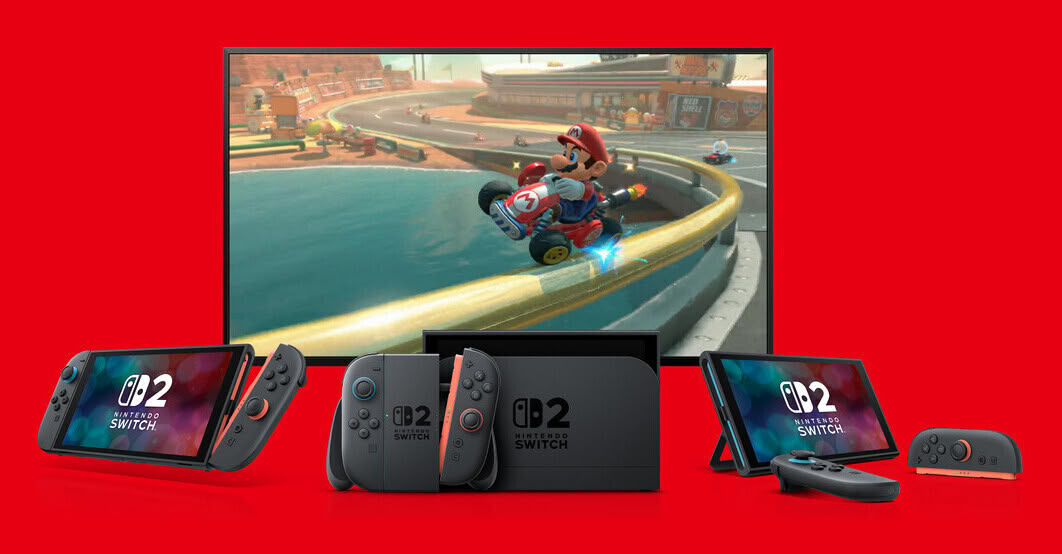
Circana data shows that as of August 2026, the cumulative expenditure on video game hardware in the United States is approximately US$2.54 billion, a decrease of 11% from the same period last year. Nintendo Switch 2 ranked first in both console sales and sales in August and year-to-date, and PlayStation 5 ranked second. However, Switch 2's lead did not reverse the overall market weakening trend. Console sales, hardware spending and game content consumption were all lower than the same period last year.
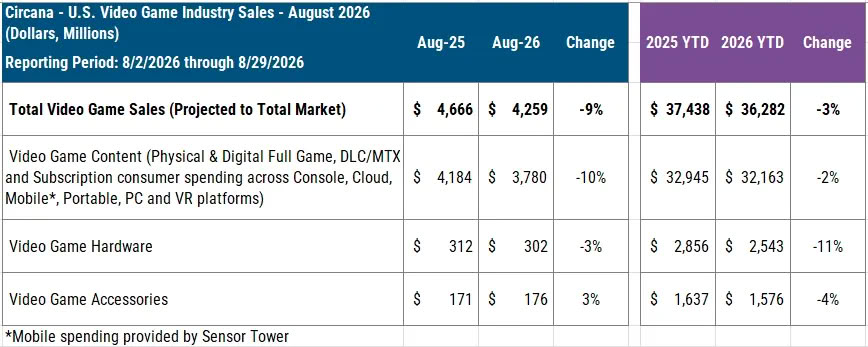
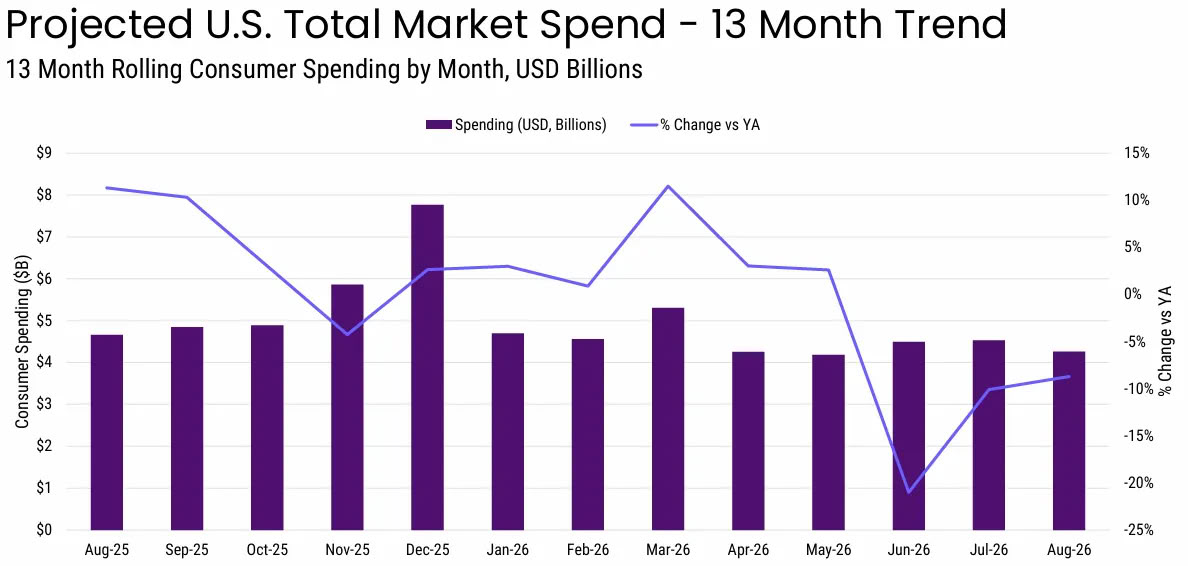
Total spending on video games, hardware and accessories in the United States fell 9% year-on-year in August to approximately US$4.26 billion. Among them, game content expenditures fell by 10% to approximately US$3.78 billion; hardware expenditures decreased by 3% to US$302 million. Console hardware sales fell 15% year-on-year, totaling approximately 559,000 units, the lowest August sales recorded by Circana since 2013. At the same time, the average price of newly purchased hardware reached $541, a record high in August, which was significantly higher than the $476 in the same period last year.
Different platforms perform differently. PS5 hardware sales increased by 17% year-on-year, but sales fell by 11%; Xbox Series sales fell by 13%, and sales fell by 31%; Nintendo hardware sales overall fell by 15%, and Switch 2 hardware sales also decreased by 13% compared with August last year. Therefore, although Switch 2 is still the best-selling console of the month, it does not mean that sales continue to grow: its market leadership coincides with the pressure on the entire console market. Factors such as price increases and the comparison base for the same period last year also affected hardware sales performance.
The weakness in overall electronic game content spending was mainly dragged down by mobile games: mobile game consumption fell by 18% year-on-year in August, and console game content spending fell by 7%; PC game content spending increased by 13%, and subscription revenue increased by 3%. Calculated on a year-to-date basis, game content expenditures are approximately US$32.16 billion, a year-on-year decrease of 2%; hardware expenditures are approximately US$2.54 billion, a year-on-year decrease of 11%; total market expenditures are approximately US$36.28 billion, a year-on-year decrease of 3%. Among them, spending on accessories increased by 3% year-on-year to US$176 million in August, but it is still down by about 4% year-to-date.
The physical game market has seen relative bright spots. As of August 2026, new entity game software spending increased by 5% year-on-year to US$738 million; among which Game-Key Card game card spending increased significantly, an increase of 631% compared with the same period last year. But this growth came from the smaller physical software segment and was unable to offset declines in mobile gaming and overall content spending. Circana previously announced that among the new physical game consumption structure year-to-date, Nintendo platforms accounted for 63% and PlayStation accounted for 32%.
On the August single-month game list, "NBA 2K27" ranked first in terms of complete game sales. Although it did not open early access until August 26, it still rose to third in the best-selling list since the beginning of 2026. "Madden NFL 27" ranked second that month, and "Marvel Tokon: Fighting Souls" ranked third; "Elden's Ring" also jumped from 41st in July to seventh in August after the Switch 2 version was launched. Overall, Switch 2 continues to consolidate its leading position in the console market, and physical games and some PC content are still growing. However, rising hardware prices and declining mobile game consumption have put pressure on the total spending in the U.S. gaming market.
Comments