
Abstract:
Microsoft is developing a new feature for Excel called Copilot Canvas, which attempts to allow users to convert data in workbooks into interactive dashboards without having to manually create a large number of charts and indicators. Windows Latest reported that this feature is still under development and is expected to be available for the Windows version of Excel and the web version of Excel in September 2026.
It is reported that the core idea of Copilot Canvas is to use existing data in the workbook to automatically generate an independent visual interface. Users can view charts, key metrics, and other data insights in this interface without having to navigate through cells and data tables like in the past. For workbooks that contain large amounts of data, this approach can hopefully make the information more visual.
Microsoft also plans to integrate Copilot directly into Excel Canvas. Users can ask Copilot to adjust the canvas through natural language instructions, such as highlighting certain indicators, changing the way data is presented, or modifying the visualization content. Compared with the past method of creating multiple charts separately and adjusting them one by one, this interactive method is expected to reduce the operations required to create a dashboard.
It is worth noting that Excel Canvas does not simply copy data into a static page. Reports indicate that this feature will continue to remain connected to the underlying workbook. When users modify the data in the workbook, the charts, metrics, and insights in the canvas update. This means that it is not only suitable for one-time report production, but may also be used for business data and operational dashboards that need to be continuously updated.
From the perspective of actual usage scenarios, Excel Canvas may be suitable for sales, finance, inventory, project management and other tasks that require frequent viewing of data. Users can first maintain the original data in Excel, then use Copilot to generate a visual interface, and adjust the display focus as needed. For users who are unfamiliar with chart design or data analysis tools, this approach may lower the threshold for creating dashboards.
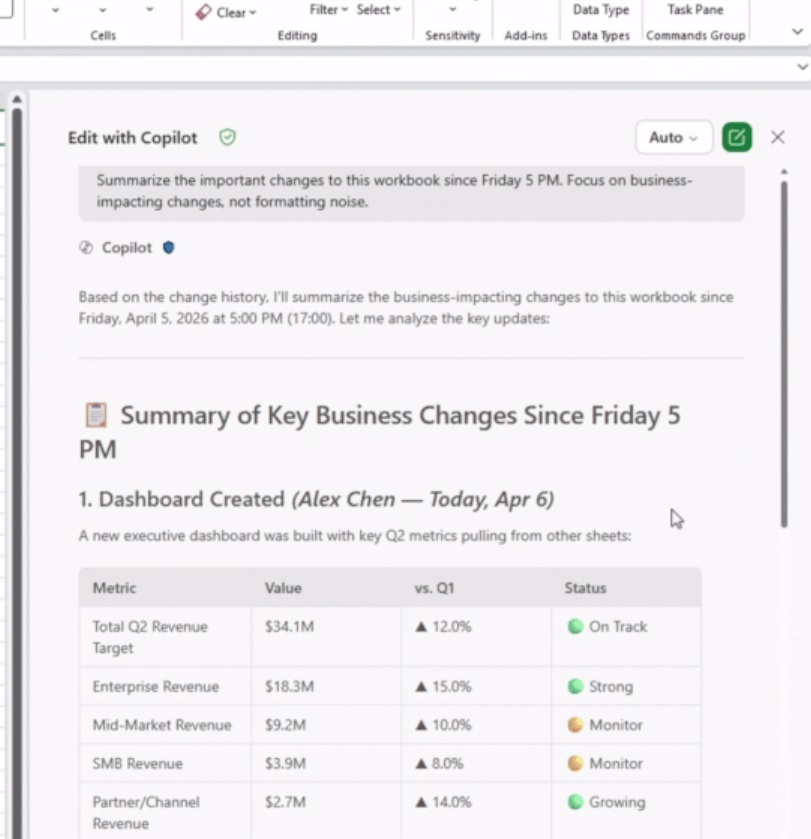
Microsoft has previously added a number of Copilot functions to Excel, including data analysis, chart generation, formula suggestions, etc. The launch of Canvas further advances AI from "helping users analyze data" to "helping users build a complete data display interface." If the function is finally implemented as currently envisioned, Excel may, to a certain extent, take on some of the work that used to be done with tools such as Power BI.
However, the specific relationship between Excel Canvas and Power BI still needs further explanation from Microsoft. Power BI natively supports converting Excel data into interactive dashboards, while Canvas is more like a lightweight visualization tool embedded directly into the Excel workflow. How the two will be differentiated in the future may depend on the data scale, interaction capabilities and enterprise-level functions supported by Canvas.
Currently, Microsoft has not announced the complete feature list of Excel Canvas, nor has it disclosed specific subscription requirements or official release time. Although Microsoft's roadmap shows that this feature is expected to be available in September 2026, this does not mean that all users will be able to use it immediately, and the actual launch time and open scope may still change.
Overall, the significance of Excel Canvas is to further reduce users’ manual work when making data dashboards. For those who are accustomed to using Excel to process data, if the visual interface can be generated directly through natural language and continuously updated, this function may become a more practical upgrade of Copilot in office scenarios.
Comments