
Abstract:
Anthropic posted a science blog: Brice Ménard, an astrophysicist at Johns Hopkins University (also a researcher at Anthropic), used his own scientific research workbench Claude Science to make the first complete all-sky ultraviolet map. In this map,
about one-third of the sky has never been seen by any ultraviolet telescope and was predicted by Claude
, and label each pixel "actual measurement/prediction", and attach an error estimate.

According to the official statement, it took a few weeks to do this work. It took a few days with the help of Claude, and Ménard was busy with other projects these days. What a special AI4S
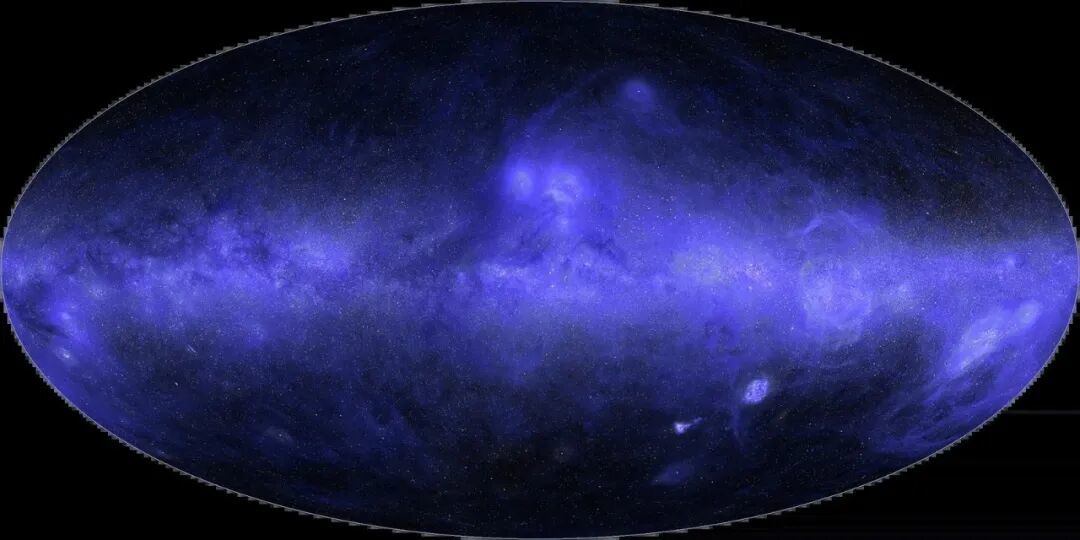
All-day UV map
Why is there a missing piece of UV
When Ménard takes astrophysics classes, he often starts by showing students how the same sky looks in different wavelength bands: in visible light, there are mainly stars; in infrared, the dust particles in the Milky Way belt are glowing; in radio, the stars and dust are faded, and hydrogen, the raw material for making stars, appears; and in X-rays, phenomena such as star explosions and matter spiraling into black holes
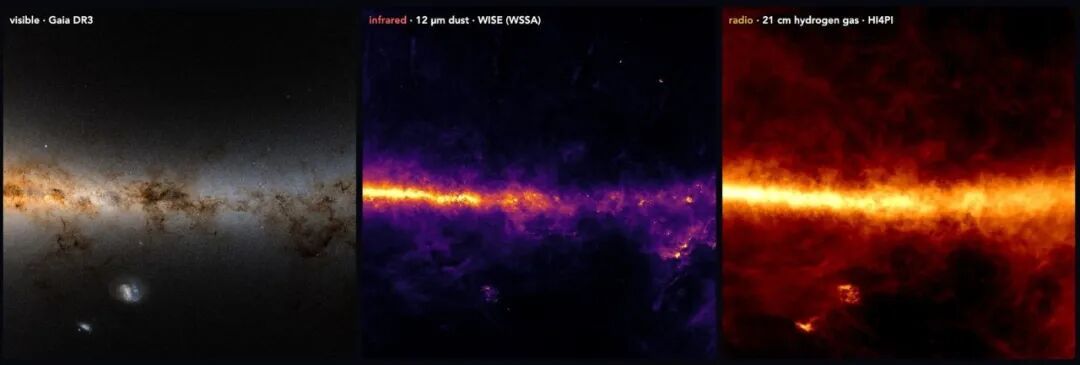
Visible light, infrared, radio
There is a lot of information worth exploring in ultraviolet light, such as dust illuminated by starlight, from clouds around young stars, to rings left behind after star explosions...
But every time the course talks about this, Ménard said that he always has to apologize first, because the current ultraviolet map will always have an empty area, and ultraviolet rays will be absorbed by the ozone layer in the atmosphere. Even when observing from space, several telescopes will only observe one area of the sky
The largest observational data here comes from NASA's ultraviolet survey satellite GALEX, which took about 38,000 images between 2003 and 2013, covering about two-thirds of the sky.
It deliberately avoids places where bright stars gather, including the entire Milky Way disk
, afraid that strong light will burn out the detector. Later, NASA's Swift and South Korea's FIMS/SPEAR added some, but together there are still several blanksIf you want to ask whether it is possible to put these pictures together, it is technically possible, but it is extremely troublesome: it requires pixel-by-pixel calibration, but astronomers always have more urgent research at hand, so this kind of work is always put off
emmm..."the slow, low-priority work that scientists always put off"
Let Claude make up the sky
This summer, Ménard decided to use Claude Science to create this image. The instruction is just one sentence: find all the UV data that can be found, unify it on the same scale, synthesize a picture, and then fill in every piece of sky that has never been seen by an ultraviolet telescope
After Claude receives the task, the process is roughly like this:
First search for publicly available UV survey data online, and then download it (the amount of data here is huge, there are tens of thousands of pictures from GALEX alone, taken over many years and under different conditions)
The next step is to clean the data to make each data internally consistent and process the area around the bright star, where there will be some glare
Then the coordinate system is aligned, and the data obtained through multiple instruments are cross-calibrated, redrawn to the same resolution, and aligned to the same coordinate system
There is one third of the blank space in the entire map. Ménard asked Claude to use inpainting: the model looked at a large number of photos to fill in the damaged and missing parts
After several rounds of corrections,
the difference between the corrected one and the real measurement is only about 10%
, the difference is almost invisible to the human eyeFinally, Claude calculated the ultraviolet brightness of 100 million stars based on the visible light measurements of the European Space Agency's Gaia satellite, and superimposed them on the completed background. The first version of the complete all-day UV map is here
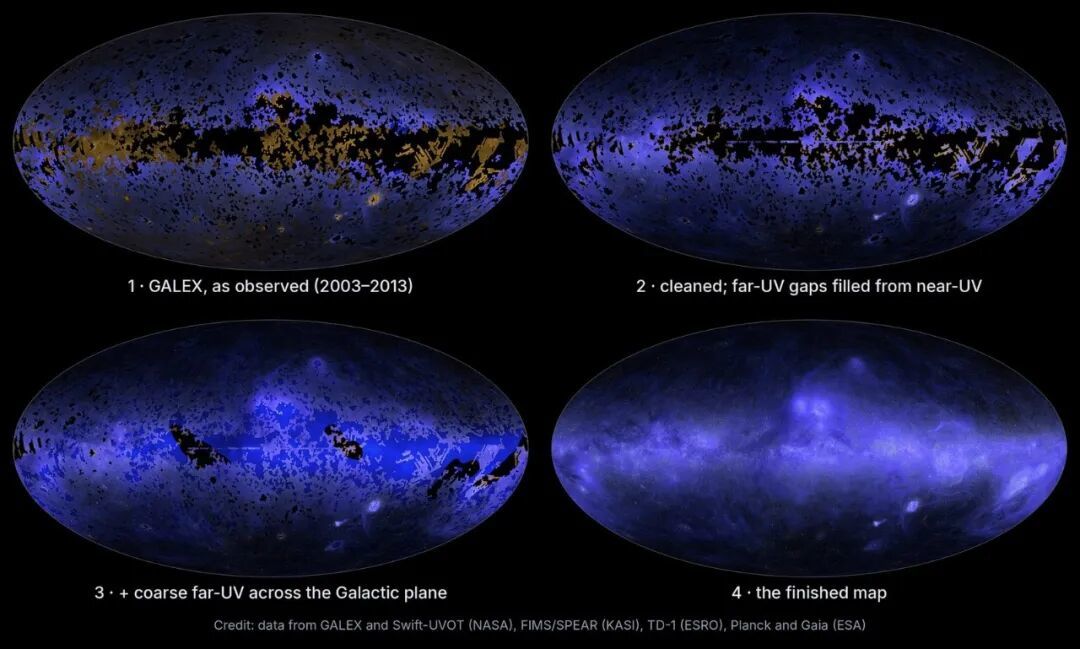
From full of holes to filling them up, there are four steps in total
The entire pipeline is in one picture: the cylinder is public data, the blue box is the steps Claude performed according to the rules, the purple box is the part it learned using statistical methods, and the green box is the fusion and finished product. The integration step is prioritized. GALEX actual measurement is ranked first, and model prediction is ranked last. Where there is actual measurement, prediction does not have the say.
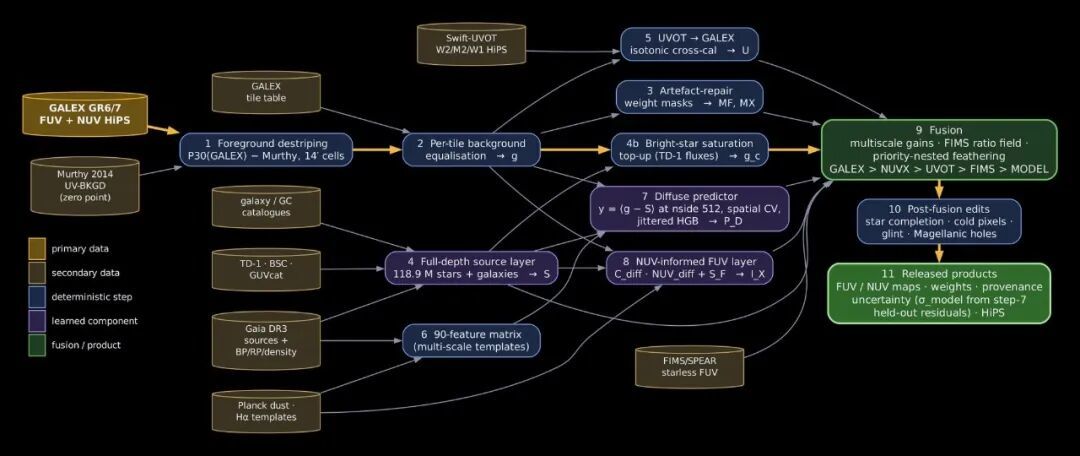
It looks complicated, but it is actually complicated
Human in a little loop
During the entire mission, Claude also made a bit of a fool
One night, Ménard looked through the processed pictures and saw something was wrong in the darkest area of the sky: faint circles, each one a little lighter or darker than the next one. These circles were the "footprints" of a single shot by GALEX. Every time GALEX takes a circular sky area, each picture is mixed with a layer of uneven ultraviolet glow from the earth's atmosphere. If it is not captured completely, there will be a difference in brightness between the circles
This issue was included in the list of known issues by Claude at the beginning of the project, but the map still
passed two rounds of reviews by other agents, and was finally discovered by Ménard himself with his own eyes in one night
All he said to Claude was: "I can see discs one after another, which are the impressions of a single observation. Can you fix them?"
The agents followed the traces of the atmospheric glow and Claude recalibrated all 38,000 observations. After working on it for several hours, the circle is gone
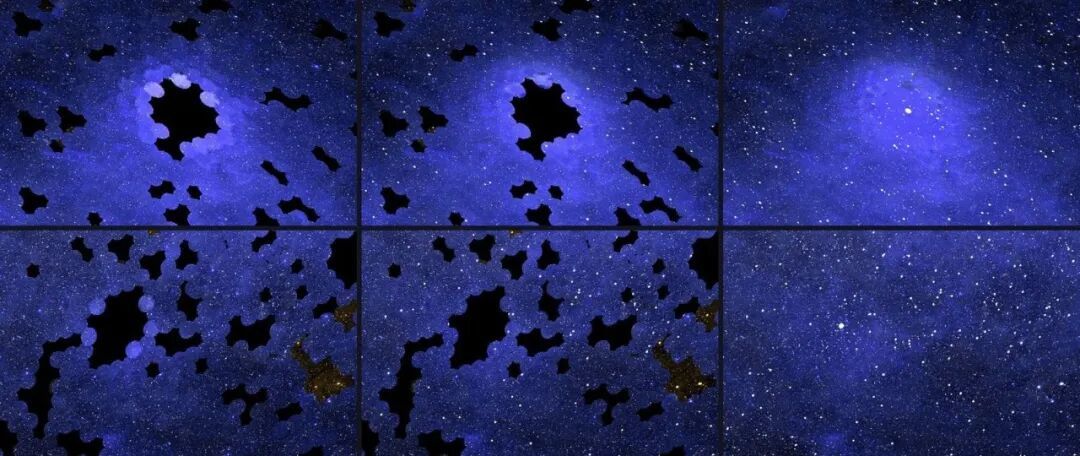
There is still a circle on the left, but the circle on the right is gone
More than a dozen iterations
I have been working on this project for several days, with more than ten major versions in total. The process follows this:
Ménard chatted back and forth several times in Claude Science to decide what to do next;
Then Claude kept counting by himself for several hours while he went back to work on other projects
Back and forth
The final image is a romance of the universe. You can see the glowing dust clouds around young bright stars, and the huge dust rings left by the bubbles blown out by the explosion of massive stars; far away from the Milky Way disk, there are faint dust filaments illuminated by the starlight of the entire Milky Way; below the disk are the Large and Small Magellanic Clouds, two neighboring galaxies filled with young stars
In the acknowledgment, he thanked everyone who participated in these space missions and made the data public, and also thanked the agents in Claude Science who worked patiently. As for himself:
"My contribution is limited to guiding them"
Comments